

One of the major economic stories in recent years has been the lasting impact of inflation. While year-over-year wage growth in the U.S. remains above pre-pandemic levels, the benefit of rising wages for most households has been limited by increasing prices in many consumer categories. The U.S. Bureau of Labor Statistics is still reporting price increases of nearly 3%—notably above the 2% target inflation rate. Recent increases in the CPI primarily came from increases in the cost of dining out, utilities, and shelter.
The latter category tends to be a major pressure on household incomes. Housing is the largest regular expenditure for most households, so the failure of wages to keep up with housing prices can be especially burdensome. And since the onset of the pandemic, housing prices have skyrocketed, with the cost of homes sold in the U.S. increasing by approximately 45%.
Changes in Home Prices and Household Incomes
Household incomes have failed to keep up with increasing home prices
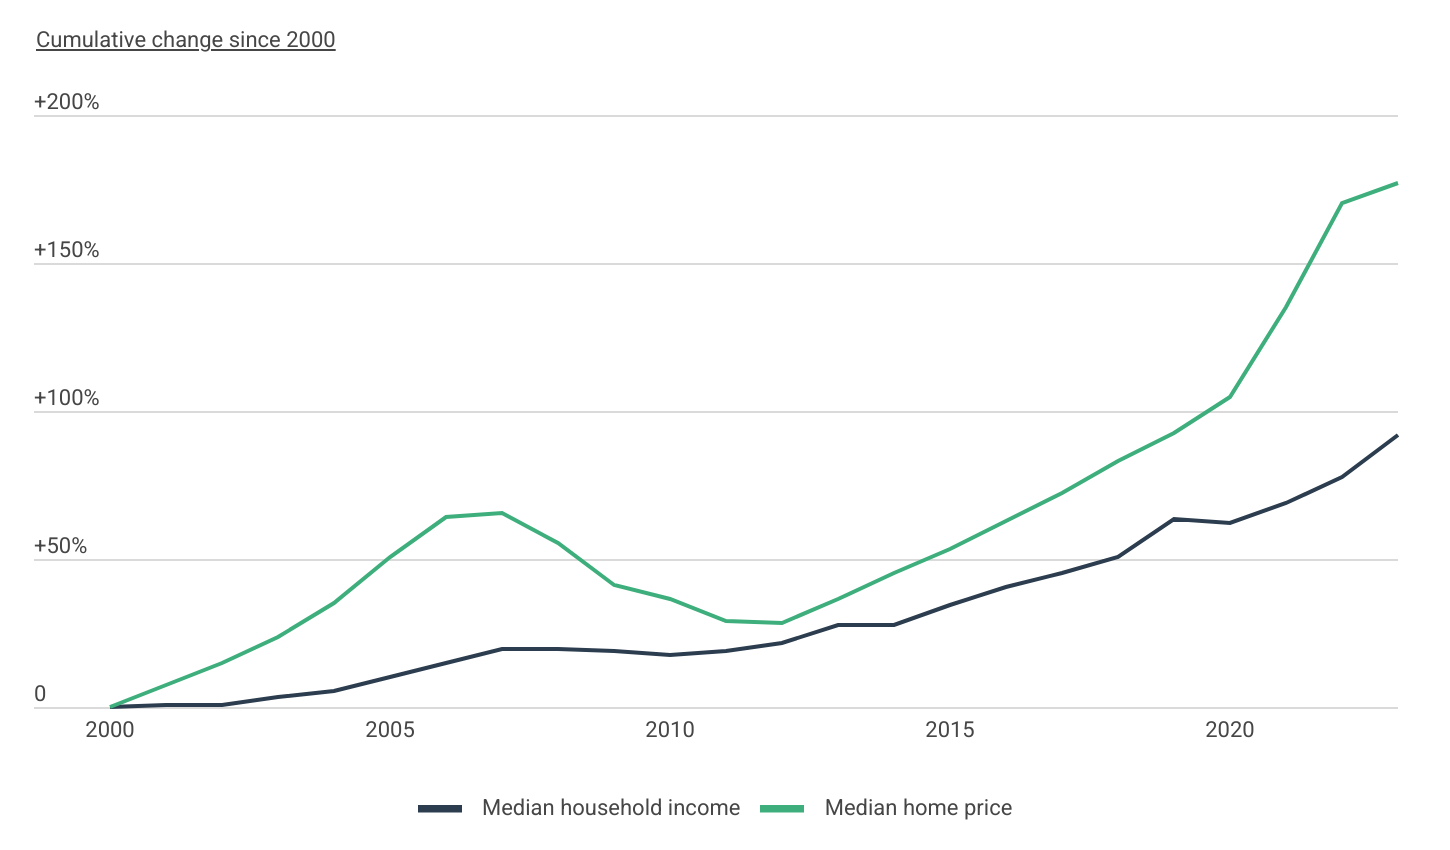
Source: Construction Coverage analysis of Zillow and U.S. Census Bureau data | Image Credit: Construction Coverage
The gap between income growth and rising housing costs isn’t new—it’s been widening for decades. Since 2000, the median household income in the U.S. has grown by 92%, climbing from $41,990 to $80,610. But during that same period, median home prices have nearly tripled, jumping 177% from $122,775 to $339,937, according to data from the U.S. Census Bureau and Zillow. On an inflation-adjusted basis, household incomes have increased by just 8.5% since 2000, while home prices have increased by more than 56%.
Geographical Differences in Home Price Growth
Home prices in the Mountain West, New England, and South Atlantic are growing the fastest
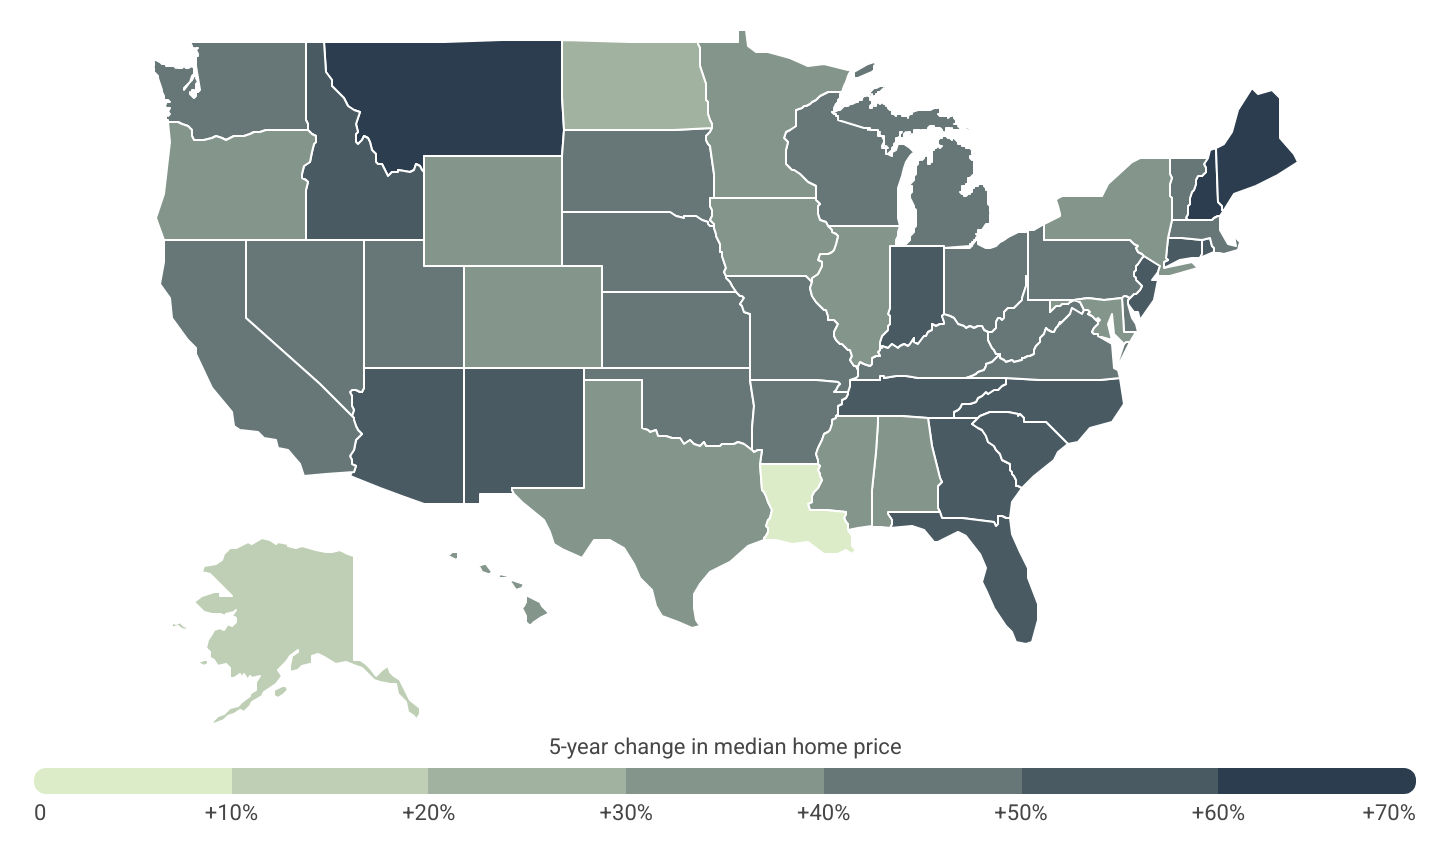
Source: Construction Coverage analysis of Zillow data | Image Credit: Construction Coverage
In recent years, home prices have climbed rapidly across much of the U.S., but certain regions stand out for especially sharp increases. States in New England have seen some of the fastest growth, led by New Hampshire, where the median home price has jumped 67.3% over the past five years. Maine, Connecticut, and Rhode Island have also experienced significant gains, each with price increases exceeding 57%.
Meanwhile, states in the Mountain West and South Atlantic regions are not far behind. Montana and Idaho have both seen home prices rise by more than 56%, while Southern states like North Carolina, Georgia, Florida, and Tennessee have posted similarly steep gains.
Price-to-Income Ratio by State
Western states & Hawaii have the most unaffordable homes
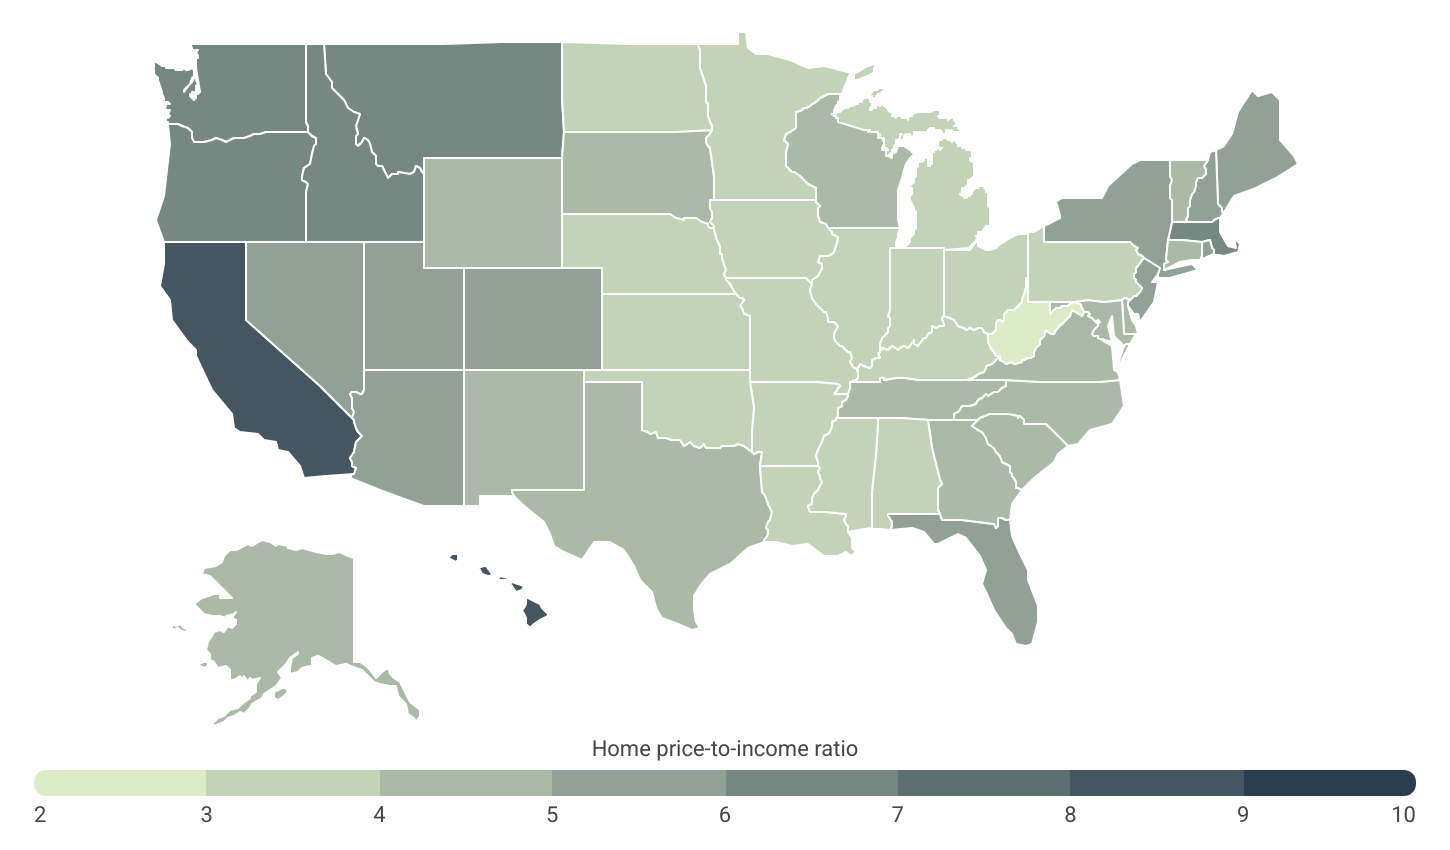
Source: Construction Coverage analysis of Zillow and U.S. Census Bureau data | Image Credit: Construction Coverage
While sharp increases in home prices over the past five years have worsened affordability in many parts of the country, the most unaffordable states overall aren’t necessarily the ones with the biggest recent price spikes. In fact, several of the states that top the list for housing unaffordability have had relatively modest home price growth in recent years compared to other states. However, their home prices were already exceptionally high to begin with.
For example, both California and Hawaii experienced below-average growth in median home prices over the last five years (41.0% and 36.6%, respectively), yet they remain the most unaffordable states in the U.S., with price-to-income ratios of 8.2 and 8.8. These high ratios indicate that even with moderate recent price increases, housing remains out of reach for many residents.
On the other hand, states like Montana and Idaho have become significantly less affordable due to rapid home price growth since 2020. Both states saw median home prices jump more than 56% over five years, pushing their price-to-income ratios above 6.0—among the highest in the nation. Overall, several Mountain West and Western states now rank among the most unaffordable in the U.S. by this metric. The national price-to-income ratio is 4.6, but the top 10 states—eight of which are in the West—have ratios of 5.8 or higher.
At the city level, the situation is even more extreme. Five of the six large U.S. cities with the highest price-to-income ratios are in California—underscoring the state’s persistent affordability crisis. Los Angeles, San Jose, Long Beach, San Francisco, and San Diego all top the list, with ratios ranging from 9.6 to 12.2. Beyond California, other major cities facing similar pressures include New York City, Miami, and Boston, where home prices still far outpace local incomes.
Here is a summary of the data for Alabama:
- Home price-to-income ratio: 3.6
- Median home price: $225,539
- Median household income: $62,212
- 5-year change in median home price: +39.9%
- Mortgage holders spending >30% of income on housing: 23.2%
For reference, here are the statistics for the entire United States:
- Home price-to-income ratio: 4.6
- Median home price: $357,138
- Median household income: $77,719
- 5-year change in median home price: +45.5%
- Mortgage holders spending >30% of income on housing: 28.5%
For more information, a detailed methodology, and complete results, see Cities With the Highest Home Price-to-Income Ratios on Construction Coverage.
