

The need for affordable housing in the United States has never been greater. After a dizzying run-up in residential real estate prices and rents in the last few years, housing costs are putting a financial squeeze on renters and homebuyers nationwide as they compete for a scarce, expensive supply of housing.
Research from federal mortgage backer Freddie Mac estimates that the U.S. is short 3.7 million housing units relative to current market needs, while the National Association of Realtors pegs the figure even higher at 5.5 million units. Regardless of the precise number, it is clear that the U.S. housing supply is insufficient, creating more competition for fewer units.
Experts cite a variety of factors that contribute to difficulties adding housing stock. In every state and locality, housing development may be subject to a host of laws and regulations regarding zoning, land use, building standards, environmental protection, historic preservation, and other issues that make it difficult to add housing. Developers and political officials may also face organized pressure from “not in my backyard” (NIMBY) interests concerned about neighborhood property values, overcrowding, or disruptions from construction work. Further, rising labor and material costs have made it more expensive to build over time, which impacts the type of units builders can afford to construct along with project timelines and costs.
Trends in U.S. Housing Construction Over Time
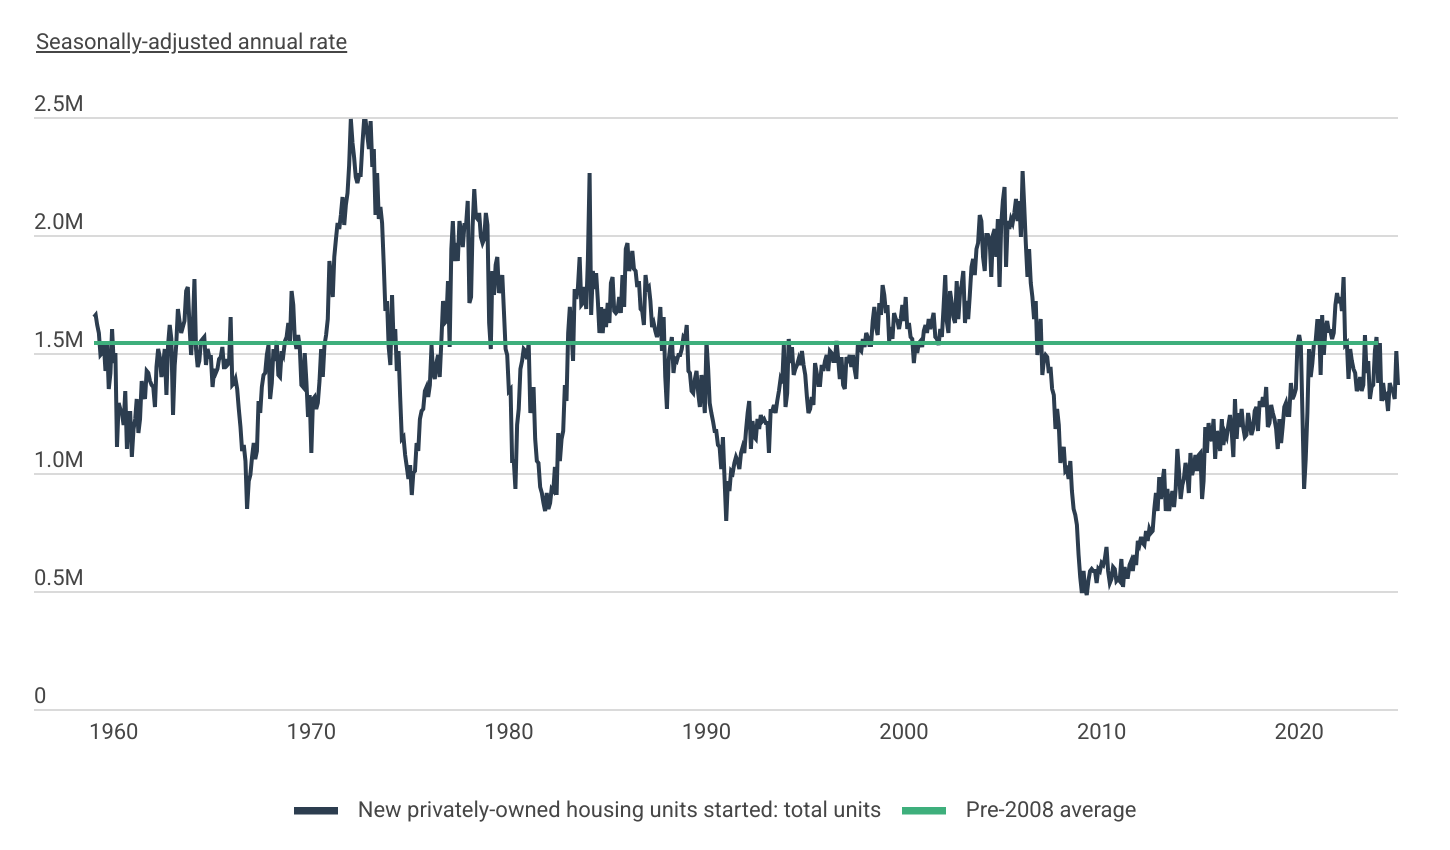
Since the 2008 housing market crash, the U.S. has underinvested in new residential construction
Source: Construction Coverage analysis of Census Bureau data | Image Credit: Construction Coverage
Beyond these conditions, one of the most significant drivers for the current undersupply of housing is the long-term impact of the Great Recession. Following the collapse of the housing bubble in the mid-2000s and the ensuing economic downturn, construction companies were extremely hard-hit. The industry experienced mass layoffs, many firms shuttered or were absorbed into others, and residential construction activity slowed dramatically. The annual rate of housing starts fell from more than 2 million at the height of the housing market in 2006 to just 490,000 at the beginning of 2009. After a prolonged recovery, housing starts did not exceed pre-2008 averages again until the beginning of 2020.
Since then, however, new home construction has decreased back below pre-2008 levels. As of January 2025, the seasonally adjusted annual rate of new housing starts stands at 1.37 million—roughly 25% below the recent peak of 1.83 million observed in April of 2022.
Housing Growth by State
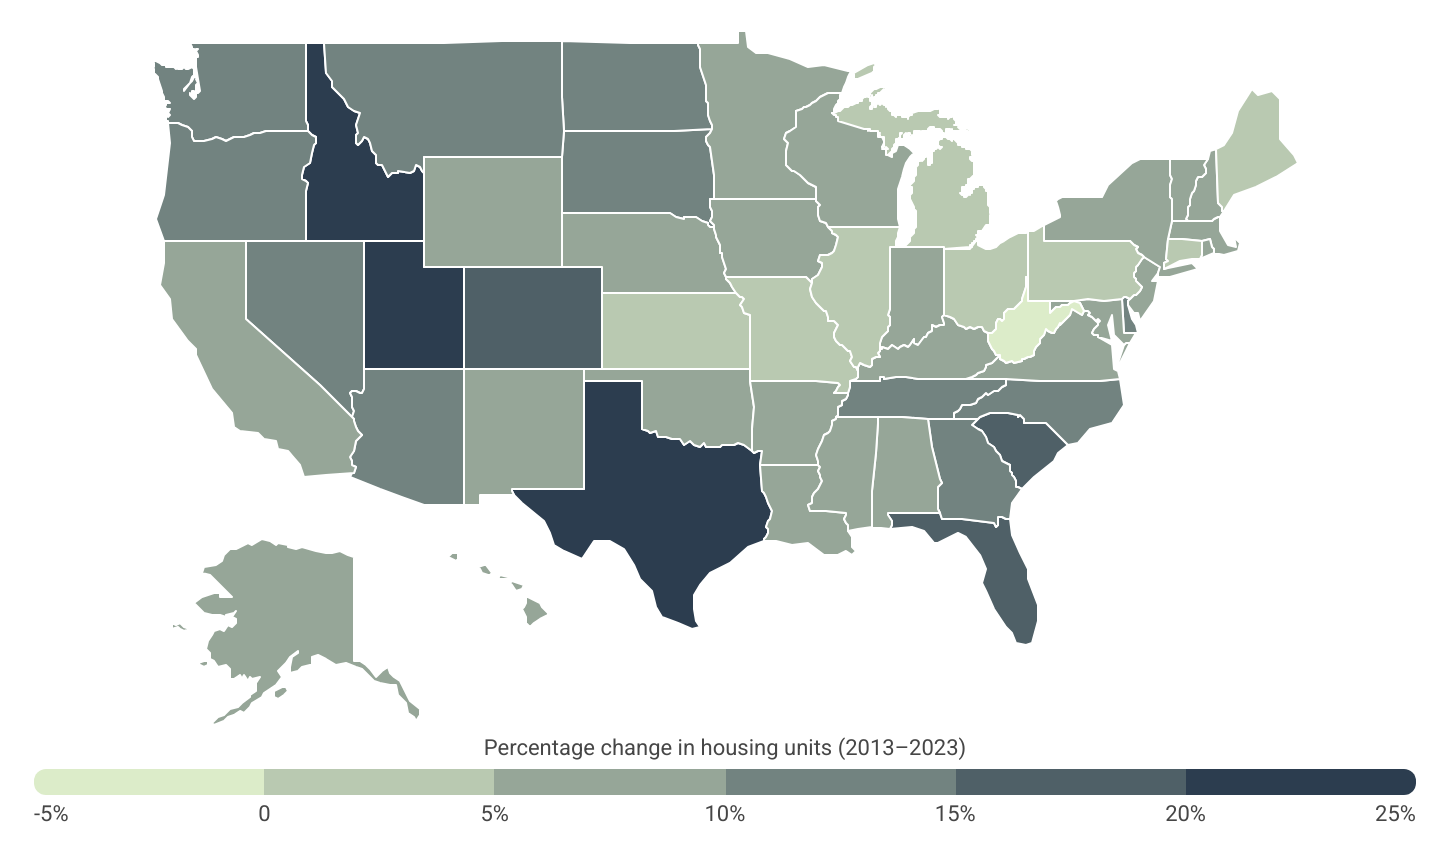
Mountain West states & Texas have added the most housing over the past 10 years
Source: Construction Coverage analysis of Census Bureau data | Image Credit: Construction Coverage
While the national supply of housing has been lagging overall, some parts of the country have managed to add homes faster than others. States that have experienced the most housing growth in recent years are largely found in the Mountain West and Sun Belt regions, which tend to be less expensive than heavily developed coastal markets and have fewer regulations limiting construction.
Utah leads the nation with a 25.1% increase in housing units, followed by Texas at 20.9%. Other western states, such as Idaho (+20.6%) and Colorado (+17.4%), rank third and fourth, respectively. Notably, Sun Belt states like Florida, South Carolina, Nevada, and North Carolina also feature prominently in the top 10, reflecting a broader trend of population growth and housing development in these regions.
In contrast, West Virginia is the only state to experience a net decline in housing stock, decreasing by 1.8%. Meanwhile, Great Lakes states such as Michigan, Illinois, and Ohio have seen relatively slow housing growth, reflecting broader trends of population stagnation or decline in the region.
Housing Growth vs. Population Growth for U.S. Counties
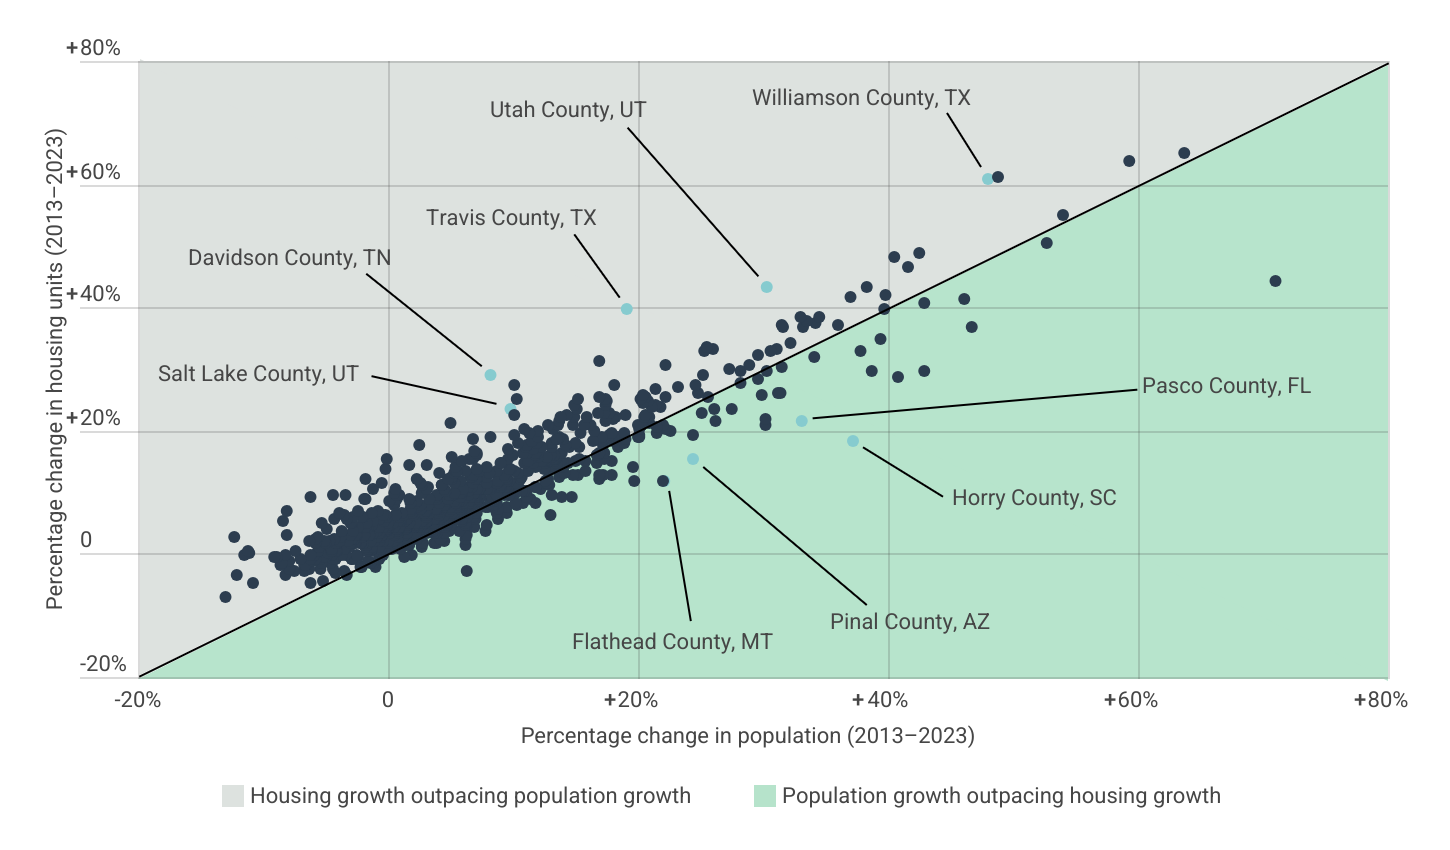
Relative to population growth, locations in Tennessee, Texas, and Utah have added housing at a faster pace than average
Source: Construction Coverage analysis of Census Bureau data | Image Credit: Construction Coverage
Measuring housing supply growth alone does not fully capture how well a location is meeting current and future housing needs. In some counties, new housing is being built at a faster rate than the population is growing, which helps maintain affordability and prepares these markets to accommodate future residents. This trend is particularly evident in states such as Tennessee, Texas, and Utah, where several counties have added housing stock faster than they have added people.
For example, in Travis County, TX—part of the Austin metropolitan area—housing growth outpaced population growth by more than two-to-one between 2013 and 2023 (+39.7% housing growth vs. +19.1% population growth). The trend is even more pronounced in Davidson County, TN (part of the Nashville metro), where housing growth exceeded population growth by more than three-to-one. Such dynamics suggest that these areas are better positioned to keep housing costs in check while preparing for continued in-migration.
Conversely, in parts of Florida, South Carolina, and Montana, the opposite trend is unfolding. Population growth in these regions has outstripped the pace of new housing construction, increasing competition for available homes. If this imbalance persists, housing affordability challenges may intensify as demand continues to outpace supply.
Here is a summary of the data for Alabama:
- Percentage change in housing units (2013–2023): +7.8%
- Percentage change in population (2013–2023): +5.7%
- Percentage change in median home price (2013–2023): +73.9%
- Total change in housing units (2013–2023): +170,093
- Total change in population (2013-2023): +274,746
- Total change in median home price (2013-2023): +$92,905
- Total housing units (2023): 2,360,120
- Total population (2023): 5,108,468
- Median home price (2023): $218,620
For reference, here are the statistics for the entire United States:
- Percentage change in housing units (2013–2023): +9.4%
- Percentage change in population (2013–2023): +5.9%
- Percentage change in median home price (2013–2023): +103.1%
- Total change in housing units (2013–2023): +12,525,325
- Total change in population (2013-2023): +18,786,057
- Total change in median home price (2013-2023): +$172,566
- Total housing units (2023): 145,333,462
- Total population (2023): 334,914,896
- Median home price (2023): $339,937
For more information, a detailed methodology, and complete results, see U.S. Counties That Have Built the Most Housing Over the Past Decade on Construction Coverage.
