


Min An
Summer isn’t complete without four cookouts, three getaways, two concerts and two festivals, according to a recent poll.
The survey of 2,000 Americans uncovered the must-haves for a perfect summer, barbecue trends and the most popular barbecue foods and flavors on Americans’ grills.
Two-thirds of Americans (66%) said summer grilling season is their favorite time of year and over a quarter (27%) confessed that no matter what season it is, they’re always looking forward to next year’s summer barbecue season.
Conducted by Talker Research on behalf of SpartanNash, the study found that Americans plan to attend five barbecues this summer and host four, on average.
Gen Z was more likely than any other generation to say summer isn’t complete without at least one barbecue.

Z Grills Australia
According to results across generations, there are 11 guests, on average, at the perfect cookout and most respondents believe barbecuing is a communal effort, as 64% stated that it’s a sin to show up to a cookout without bringing anything to share.
Looking at grilling trends more closely, the most popular cookout sides are potato salad (60%), corn on the cob (54%), baked beans (53%) and watermelon (48%), though this did vary by generation.
While 70% of baby boomers reach for potato salad, tastes are changing, with about half of millennials (47%) and Gen Z surveyed (53%) voting for mac and cheese as their favorite side of choice.
Regardless of the sides they’re enjoying, the survey found the top cookout activities are cards (27%), cornhole (26%) and swimming (24%).
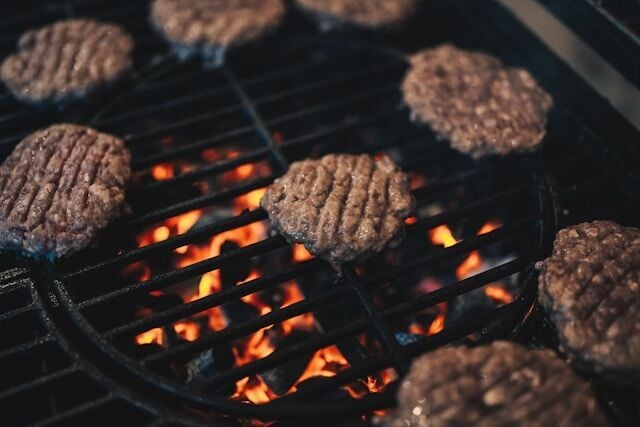
And taking a closer look at the main event — what’s actually on the grill — the survey asked Americans about their favorite grill staples and found that hamburgers (77%), hot dogs (65%), chicken (55%), steak (54%), ribs (46%) and bratwurst (25%) are most loved.
The poll asked respondents about which shoes they like to fill at a barbecue and found that 20% prefer to staff the grill as the “grill master” and 22% like to be in charge of the side dishes as the “sides supervisor.”

Richard Wang
Twelve percent enjoy organizing the desserts as the “sweets specialist,” and another 12% opt to cover the drinks as “cooler captain.”
Taking a snapshot of America’s barbecue veterans or “grill masters,” most (61%) have been grilling for over 20 years and 45% said they fire up the grill at least once a week.
“Summer is the perfect time for cookout favorites – from a brat with all the toppings to a table full of sides, salads and other barbecue staples,” said Erin Storm, senior vice president and chief marketing officer. “With a variety of grilling staples, sides and brats, we’re excited to give grill masters a one-stop destination to explore bold, new flavors and create the ultimate summer grilling experience.”
The survey looked at grilling flavor preferences and found that most people (77%) like to try new flavors when grilling or attending a cookout.
And Americans’ favorite flavors on the grill are barbecue flavor (61%) garlic (34%), a generally smoky flavor (30%), teriyaki (25%), honey (25%) and brown sugar (24%).

Evan Wise
Uncovering consumption habits for one of Americans’ favorite grill staples, bratwurst, 43% said they eat brats at least once per month — and only one in 10 (13%) of brat eaters will have theirs plain.
The best brat toppings varied greatly by generation. While mustard came out as the No. 1, it might be on its way out, as 60% of baby boomers selected it, compared to just a third of Gen Zers.
Sauerkraut is also fading in popularity, as it was revealed to be a favorite topping for baby boomers (40%), but not so much for Gen Z (11%). Instead, younger generations are increasingly reaching for cheese and peppers — toppings that generationally, baby boomers were the least likely to select.
And the best way to cook bratwursts, according to the poll, are on a grill (52%), over an open fire (13%) and in a smoker (11%).
“It’s clear that grilling season brings people together, whether it’s to enjoy classic summer staples or to discover new, unexpected flavors,” said Storm. “While the ingredients for the best summer ever might look a little different from cookout to cookout, our goal is to offer fresh, fun and unique options for every picnic table all summer long.”

Emerson Vieira
TOP GRILLING STAPLES
- Hamburgers - 77%
- Hot dogs - 65%
- Chicken - 55%
- Steaks - 54%
- Ribs - 46%
- Bratwurst - 25%
- Kabobs - 22%
- Pork chops - 21%
- Fish - 15%

James Robertson
TOP BARBECUE BEVERAGES
- Soda/soft drinks - 58%
- Iced tea - 47%
- Water - 47%
- Lemonade - 44%
- Beer - 31%
- Fruit punch - 20%
- Fruit juice - 20%
- Wine - 16%
- Cocktails - 13%

Bence Balla-Schottner
FAVORITE COOKOUT GAMES
- Cards - 27%
- Corn hole - 26%
- Swimming - 24%
- Horseshoes - 22%
- Frisbee - 16%
- Badminton - 11%
- Basketball - 11%
- Football - 10%
- Beer pong - 10%

Vincent Keiman
Survey methodology:
Talker Research surveyed 2,000 Americans; the survey was commissioned by SpartanNash and administered and conducted online by Talker Research between April 30 and May 5, 2025.
We are sourcing from a non-probability frame and the two main sources we use are:
- Traditional online access panels — where respondents opt-in to take part in online market research for an incentive
- Programmatic — where respondents are online and are given the option to take part in a survey to receive a virtual incentive usually related to the online activity they are engaging in
Those who did not fit the specified sample were terminated from the survey. As the survey is fielded, dynamic online sampling is used, adjusting targeting to achieve the quotas specified as part of the sampling plan.
Regardless of which sources a respondent came from, they were directed to an Online Survey, where the survey was conducted in English; a link to the questionnaire can be shared upon request. Respondents were awarded points for completing the survey. These points have a small cash-equivalent monetary value.
Cells are only reported on for analysis if they have a minimum of 80 respondents, and statistical significance is calculated at the 95% level. Data is not weighted, but quotas and other parameters are put in place to reach the desired sample.
Interviews are excluded from the final analysis if they failed quality-checking measures. This includes:
- Speeders: Respondents who complete the survey in a time that is quicker than one-third of the median length of interview are disqualified as speeders
- Open ends: All verbatim responses (full open-ended questions as well as other please specify options) are checked for inappropriate or irrelevant text
- Bots: Captcha is enabled on surveys, which allows the research team to identify and disqualify bots
- Duplicates: Survey software has “deduping” based on digital fingerprinting, which ensures nobody is allowed to take the survey more than once
It is worth noting that this survey was only available to individuals with internet access, and the results may not be generalizable to those without internet access.


