


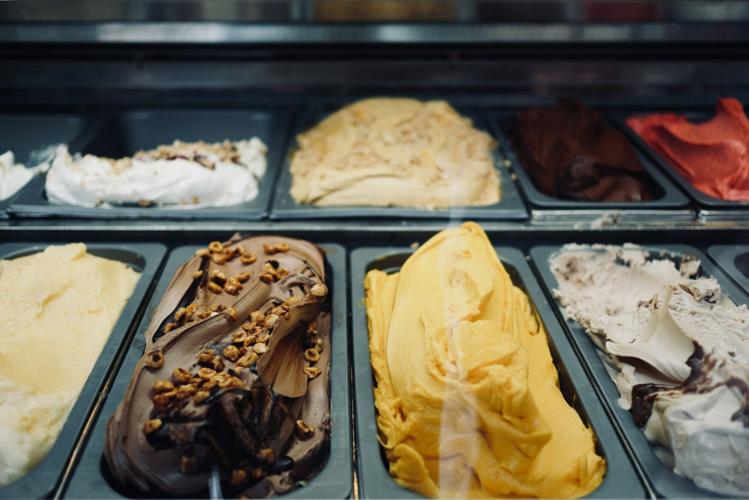


(Photo by Calebe Miranda vi
New Jerseyans are America’s biggest “ice cream connoisseurs,” according to a recent survey.
The survey of 5,000 Americans, evenly split by state, revealed respondents in New Jersey were most likely to identify as a connoisseur of ice cream (58%) — and they were tied for No. 1 as the state that loves ice cream the most.
In terms of connoisseurs, New Jersey was followed closely by those in New Mexico (56%).
Third place was a four-way tie between California, Kansas, New York and North Dakota (all at 55%).
Conducted by Talker Research and commissioned by Undeniably Dairy for National Ice Cream Month in July, the survey also looked at Americans’ favorite ice cream flavors.
Chocolate came out as No. 1 and was revealed to be the country’s favorite flavor (15%). Vanilla — the other classic — and mint chocolate chip were the next two favorites (tied at 12%).

These were closely followed by butter pecan (10%), cookies and cream (9%) and cookie dough (8%).
However, the findings indicated that taste buds differ by age. Both Gen Z (18%) and millennials (17%) labeled cookies and cream as their most-loved flavor, while Gen X (15%) and baby boomers (16%) like chocolate best.
The survey also uncovered which up-and-coming flavors people are most interested in trying for the first time this summer.
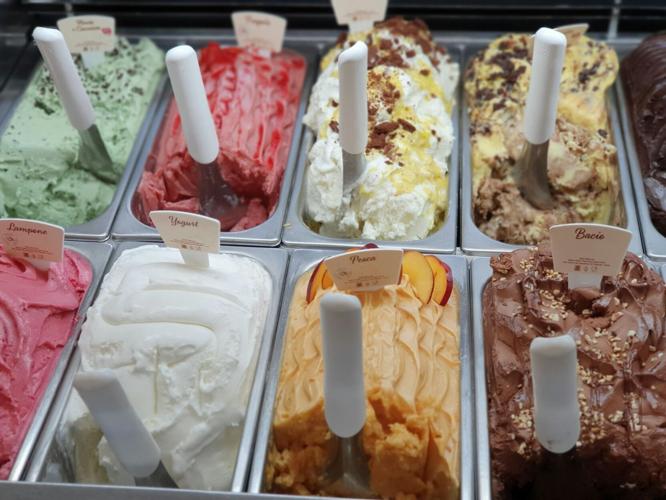
And these turned out to be black raspberry (27%), toasted marshmallow (24%), peach (22%), praline (14%) and lavender (11%).
The poll asked respondents to rate their love of ice cream on a scale from one to 10 (with 10 being the highest) and found that Americans love ice cream quite a bit, scoring an 8.6/10 on average.
However, some states love ice cream more than others. And the states that love this frozen sweet treat the most are Delaware, New Jersey, Rhode Island, South Carolina, Tennessee and Texas, all scoring an 8.9/10 on average.
Almost three-quarters of respondents (72%) said ice cream is their all-time favorite dessert, and the states that eat the most ice cream per week on average are Delaware (4 days per week), New Mexico (3.9 days per week) and Wyoming (3.9 days per week).

Omar Lopez
The results found that Friday (19%) and Saturday (29%) are the most popular days to eat ice cream and Americans are most likely to enjoy a serving of this frozen goodness at 5:42 p.m., on average.
The most common vehicle for ice cream consumption is a bowl (49%), although 35% opt for a cone and 17% like eating it straight from the carton best.
And people's most enjoyed toppings are hot fudge (48%), caramel sauce (40%), chocolate syrup (39%) and whipped cream (36%).
Desserts that are high in protein are also a priority for many (39%) and nearly a fifth of Americans (18%) are even planning to make their own ice cream at home this summer.
Which makes sense considering that respondents agreed that a hot summer day (47%) is the best occasion to enjoy some ice cream.

Mai Emoto
AMERICA’S BIGGEST ICE CREAM CONNOISSEURS
- New Jersey (58%)
- New Mexico (56%)
- California (55%)
- Kansas (55%)
- New York (55%)
- North Dakota (55%)
- Connecticut (53%)
- New Hampshire (53%)
- South Dakota (53%)
- Utah (53%)

(Photo by Katya Wolf via Pexels)
AMERICA'S FAVORITE ICE CREAM FLAVORS
- Vanilla (12%)
- Chocolate (15%)
- Strawberry (8%)
- Butter pecan (10%)
- Cookie dough (8%)
- Cookies and Cream (9%)
- Mint chocolate chip (12%)
- Pistachio (4%)
- Rocky road (6%)
- Salted caramel (8%)

abigail morris
AMERICA’S FAVORITE ICE CREAM TOPPINGS
- Hot fudge (48%)
- Caramel sauce (40%)
- Chocolate syrup (39%)
- Whipped cream (36%)
- Chopped nuts (26%)
- Cookie crumbles (22%)
- Peanut butter cups (22%)
- Sprinkles (19%)
- Strawberry sauce (18%)
- Butterscotch sauce (16%)
Survey methodology:
Talker Research surveyed 5,000 Americans (100 from each state); the survey was commissioned by the Undeniably Dairy and administered and conducted online by Talker Research between June 23 and June 30, 2025.
We are sourcing from a non-probability frame and the two main sources we use are:
- Traditional online access panels — where respondents opt-in to take part in online market research for an incentive
- Programmatic — where respondents are online and are given the option to take part in a survey to receive a virtual incentive usually related to the online activity they are engaging in
Those who did not fit the specified sample were terminated from the survey. As the survey is fielded, dynamic online sampling is used, adjusting targeting to achieve the quotas specified as part of the sampling plan.
Regardless of which sources a respondent came from, they were directed to an Online Survey, where the survey was conducted in English; a link to the questionnaire can be shared upon request. Respondents were awarded points for completing the survey. These points have a small cash-equivalent monetary value.
Cells are only reported on for analysis if they have a minimum of 80 respondents, and statistical significance is calculated at the 95% level. Data is not weighted, but quotas and other parameters are put in place to reach the desired sample.
Interviews are excluded from the final analysis if they failed quality-checking measures. This includes:
- Speeders: Respondents who complete the survey in a time that is quicker than one-third of the median length of interview are disqualified as speeders
- Open ends: All verbatim responses (full open-ended questions as well as other please specify options) are checked for inappropriate or irrelevant text
- Bots: Captcha is enabled on surveys, which allows the research team to identify and disqualify bots
- Duplicates: Survey software has “deduping” based on digital fingerprinting, which ensures nobody is allowed to take the survey more than once
It is worth noting that this survey was only available to individuals with internet access, and the results may not be generalizable to those without internet access.


